You Don’t Need Specific Knowledge
Over time, you begin to start understanding what is needed for efficient troubleshooting to happen on a consistent basis. In my interviews with great troubleshooters, all have mentioned deep knowledge of the system they’re working on as a key weapon in their arsenal. However, I hope to show you that deep experience with a particular system is not necessary to start and guide the troubleshooting process. I believe the right strategies, coupled with the right mindset and behaviors, are equal to experiential troubleshooting skills. I’m not knocking experience, it’s a powerful tool and I want you to tap into it whenever you can. I’m just challenging the notion that it’s the only entry to effective troubleshooting. Also, I’ve seen the belief that experience is needed as an excuse to do nothing. “We don’t know anything about this machine, so let’s wait until Jim takes a look at it…,” only to have Jim arrive and have no better ideas than the strategies presented here.

(image: Don O’Brien / CC BY 2.0)
But, It’s Great If You Have It
While specific system knowledge isn’t necessary to begin troubleshooting, it can be a huge bonus to the virtues and strategies. A big part of “specific knowledge” is being able to answer the question: “What is normal?” You may think you know what is normal, but unless you’re collecting and analyzing data about your systems on a regular basis, you don’t have a clue. Trust me.
You take the cover off a machine and see something that looks out of place, or notice some strange output, or hear a weird noise, or smell something unsavory coming from a machine. The next question that will invariably pass your lips will be: “Is this normal?” This question comes up all the time, and the answer is usually “Umm…I don’t know.” While “Is it plugged in?” may be troubleshooting’s most famous question, “Is this normal?” is the one most likely to be uttered by an actual troubleshooter while on the job.
Not knowing the normal operating ranges within your systems will make it difficult to determine if a particular fix has worked. If the goal of troubleshooting is getting back to normal, and you don’t know what that means, you’ll merely be hoping that you’ve solved the issue. While it might appear to be “working,” your system could be operating in an entirely new range. Your fix may just be a temporary reprieve before another catastrophic failure. So, without further ado, let’s enter the world of data collection.
(image: Branden Williams / CC BY 2.0)
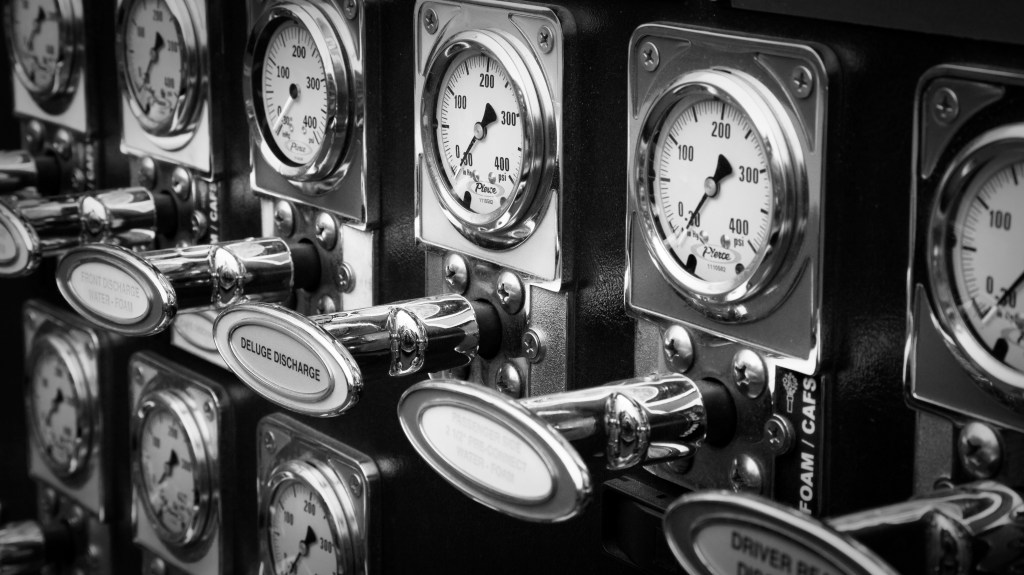
Gauges
Gauges will tell you “what’s happening now” and consequently are a great way to begin any data collection regime. Gauges don’t have a memory and therefore don’t allow for comparison to the past, but deploying them is a good first effort.
For some systems, knowing the current state may suffice if the operating parameters (i.e., the desired state) are relatively well known and unchanging. The manufacturer may have published guidelines that can be a sufficient proxy to “what is normal.” Or, “normal” may be well described in your own documentation or known among your operators.
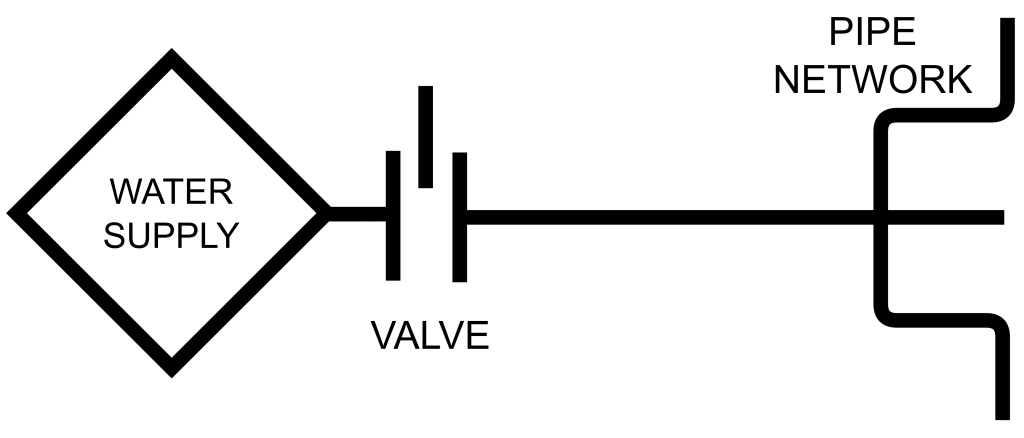
Hopefully, when problems arise, they will be visible on your gauges. Imagine a valve installed to control the flow to a water delivery system:
(image: © Jason Maxham)
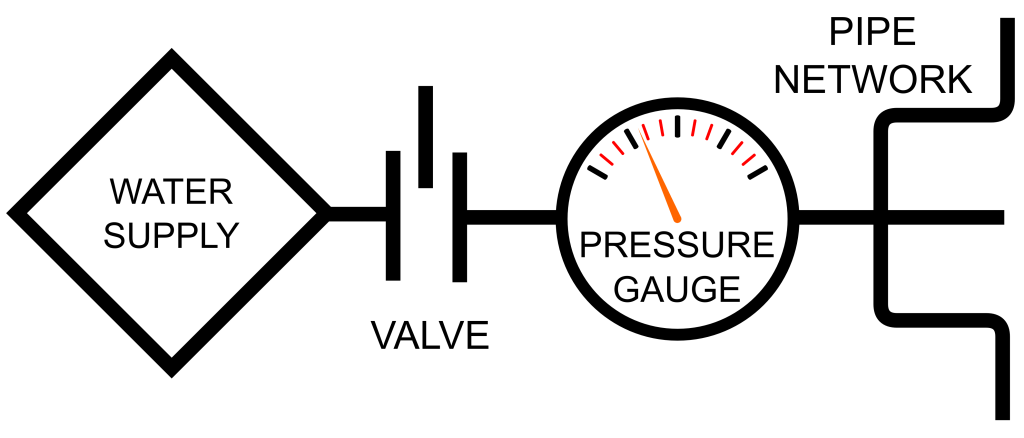
Let’s say that pipes downstream from the valve keep bursting and, after an investigation, the cause is suspected to be that the the valve was improperly set and not restricting flow adequately. There are no markings on the valve, so it’s really difficult to know what flow level has been selected. So, you put a gauge on the output side of the valve in an attempt to better understand the situation:
(image: © Jason Maxham)
Before, the valve setting would have been our focus: it was the only thing we could control. Previously, we had no information about the pressure flowing through the system, except of course when it was too much and our pipes were bursting! Now, our attention can shift to the reading on the pressure gauge, with the valve merely being a means of selecting the desired pressure level. The addition of the gauge leads to improved awareness of certain scenarios that would have been difficult to detect in its absence:
- If the gauge reads higher or lower than desired, the valve is not set properly and requires adjustment.
- If adjustment of the valve has no impact on the pressure reading, we can hypothesize that the valve is stuck or broken.
Within this simple system, troubleshooting can now be done efficiently with just this single gauge. Knowing the current state (i.e., the pressure reading) will point the way to the problem.
Gauges Don’t Have A Memory
What gauges will miss (unless you’re watching them 24/7) are intermittent problems and erratic behavior in the run-up to a failure. Imagine a boiler system with a pressure gauge that your boss has asked you to monitor. You look at the gauge hourly throughout the morning. As your omniscient narrator, I was keeping track of the readings, even though you weren’t:
| Time of day | Pressure reading |
| 08:00 AM | 104 psi |
| 09:00 AM | 101 psi |
| 10:00 AM | 102 psi |
| 11:00 AM | 102 psi |
| 12:00 PM | 104 psi |
| 01:00 PM | 0 psi |
When you get back from lunch, you hear wide-eyed tales from your co-workers of a loud explosion in the boiler room! How could this have happened? After all, you were diligently monitoring the pressure gauge all morning…
The problem is that many failures will start within (or near) the normal operating range, until breaking out. Again, unless you had been present at the time of the failure (in this case, it’s probably good you weren’t!), you wouldn’t have seen the exponential rise in pressure before the explosion. During the time of your monitoring, the pressure readings were in a tight group between 101-104 psi. There was a slight uptick at noon to 104 psi, but from these data points alone it would be difficult to tell if that was a harbinger of trouble (plus we saw a reading of 104 psi at 8am). So, you arrived back from lunch to an exploded boiler…and unfortunately a gauge that now reads zero (if it can be found among the wreckage).
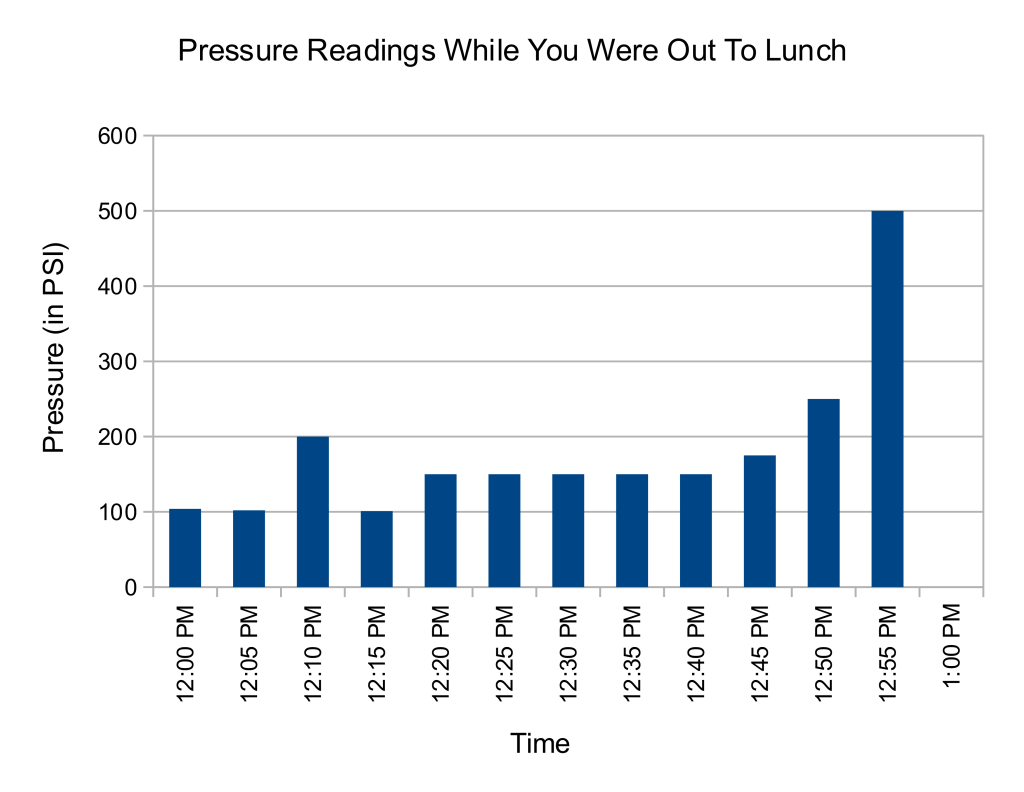
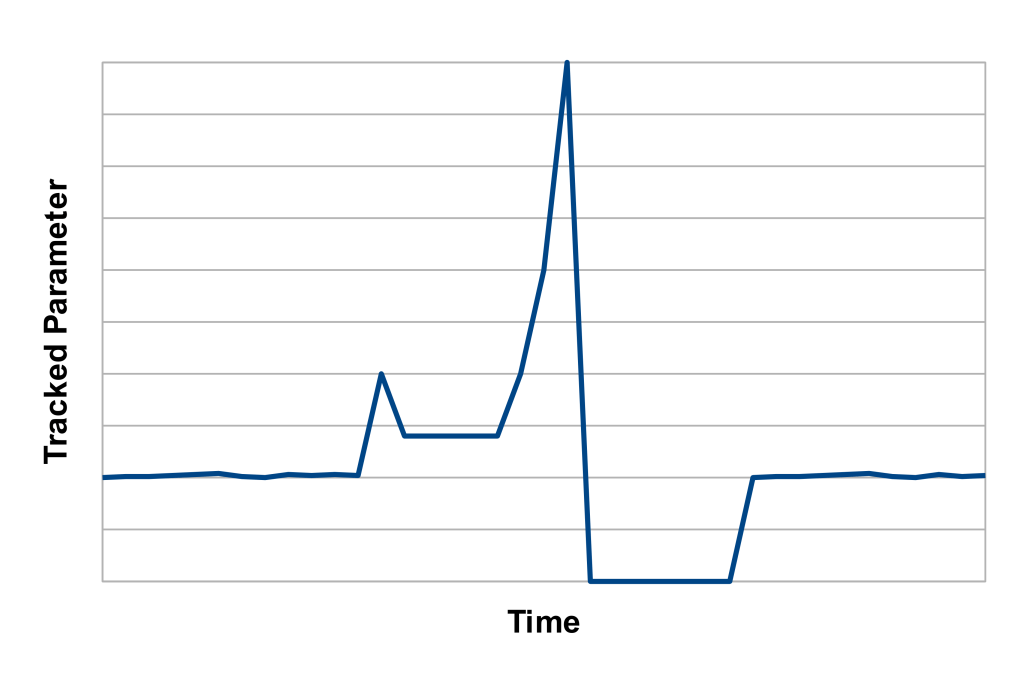
In the aftermath of an incident, knowing the current state isn’t very useful. What the gauge reads now isn’t nearly as useful as what it was reading between noon and the time of the explosion. If you had an automated data collector with graphing capabilities, you would have seen this:
(image: © Jason Maxham)
This is so much more useful than just knowing the current state! You can see the pressure building in the run up to the explosion and begin to form a theory about its cause. Here we can see a spike to 200 psi around 12:10pm and then the pressure briefly returns to a normal level. Perhaps a safety release valve kicked in and brought the pressure back down? After that, the pressure hovers around 150 psi, until going exponential. If there was a safety release valve, it clearly failed this second time around. Looking at the graph, it’s easy to pinpoint the time of the explosion as occurring between 12:55pm and 1:00pm.
By the way, I have seen this particular failure pattern so many times in so many different contexts. A system will be operating normally, then experience some kind of shock. After the shock, it will operate in a new, above-or-below-average range for a short period of time, before experiencing a complete meltdown.
So Many Things To Track
Gathering and analyzing data has an opportunity cost, so you’ll want to be judicious about how you allocate the time you devote to a data collection project. Also, in even the simplest of systems, the number of different things that can potentially be monitored and tracked is infinite. To prove this to you, take a look at this belt-driven contraption:
(image: Shaun Wallin / CC BY 2.0)
Let’s say you wish to monitor and collect data on how fast that longest belt is spinning. To do this, you’ll measure the length that the belt travels past your monitoring point within a given time period. Depending on the problems you’re trying to spot, just this parameter alone could result in an infinite number of possible data collection schemes. Perhaps the belt occasionally slips and stops moving momentarily (and you’d like to know when and how often), but that’s only something you’ll notice if you look at very small time slices (like sub-second).
Different sampling rates (i.e., the period between making subsequent observations) can lead to an endless number of possible data collection schemes. You could observe how much belt passes an observation point over the course of a second, 1/10 second, 1/100 second, 1/1000 second, etc. to infinitely small time periods. Smaller time slices might not necessarily be useful, but each sampling rate would give you slightly different information. And this is just a lone belt on a simple whoozy-whatzit. Imagine the data collection possibilities in an automobile factory or an oil refinery. Infinity times infinity!
Start Small
Given that the amount of data you could collect on a machine is infinite, you’re going to need to find a way to prioritize and make what you do collect manageable. One very efficient way is to let your breakdowns dictate what gets watched. Often when troubleshooting, you’ll find yourself saying “I wish I knew what was happening to this before the failure…” Those moments are great indicators of what to monitor in the future. There is little wasted effort with a scheme like this: you’re focusing on things that actually have tripped you up in the past!
I think you can do yourself one better by proactively surveying your systems for things to monitor so you’ll be ready when the next crisis occurs. If you have even a passing familiarity with a system, you can usually make an educated guess about what you’d like to know about in the event of a breakdown (run through some imaginary scenarios in your head or review your recent incidents for ideas). From there, let real problems guide the additional parameters you add to your data collection regimen.
Baselines Verify Fixes
For complicated systems, it can be difficult to know if a fix has worked without a good data collection system in place. I’ve worked on problems where I was sure I had nailed a fix only to have things unravel later. Over time, I began to notice a huge difference between systems where we had solid data coverage and those where we were “flying blind.” The data advantage operated on two levels:
- Good data leads the way to the discovery of the cause.
- Good data shows you if a fix is actually working.
Both of these benefits immensely increase your confidence in your repairs. It all comes back to the theme of this section: if you can’t say what is “normal” you won’t really know if the repaired system is functioning “normally.”
When your efforts finally pay off, you’ll get graphs that look like this:
(image: © Jason Maxham)
Notice how everything, from regular operation before the incident, to the onset of trouble, to the meltdown, to the recovery after the fix, is so visually apparent in this graph. It’s abundantly clear what “normal” was before the breakdown, and it’s just as clear that you have indeed returned to that normalcy after the repair. When this happens for the first time, expect to get a little choked up. Beautiful.
War Correspondent
During crises, you should be collecting a very specific type of data: what fixes you’ve tried and when. I’ve been called in to troubleshoot some very hectic situations and gone immediately into “let’s try this, then let’s try this, and then how about this” mode. The energy of the crisis fuels an endless stream of ideas and avenues to pursue. However, if the problem persists and you don’t find a quick fix, you may find that you begin to accidentally repeat yourself. You may catch yourself in a moment of deja vu and ask, “Didn’t we already try this?” To avoid this looping, I suggest you start a simple troubleshooting log at the beginning of any crisis. If you want to call it “My very secret and very special diary of my most precious fix-it feelings,” that’s your prerogative. Oh, and this idea isn’t only for crises: any long-term troubleshooting project benefits from such a record of happenings.
A related concept is the maintenance log, which is a list of changes made to a machine, including when they were made and by who. You might have seen these pasted in the interior of a service panel or dangling from a clipboard nearby. Along with other maintenance records, these are a very valuable source of data that are great for answering the question: “What’s changed?”
Start Now
The past will be murky if you weren’t keeping track of it, so orient yourself to a bright future and commit to start collecting data. Yesterday may remain shrouded in mystery, but at least you’ll have data to make comparisons for the next incident.
References:
- Header image: Leffler, W. K., photographer. NATIONAL OCEANOGRAPHIC AND SCIENCE CENTER – seismograph report of L.A. earthquake. 1971. [Photograph] Retrieved from the Library of Congress, https://www.loc.gov/item/2017646241/.
